
LATTICE CONSTANT DETERMINATION AND RECIPROCAL SPACE MAPPING
1. Crystal perfection evaluation utilizing X-ray rocking curve (ω scan) with high-resolution optics
X-ray rocking curve measurement is a technique used to evaluate the crystal quality of crystalline films and mono-crystal substrates. The peak width (FWHM) of measured rocking curve profiles contains information on the orientation distribution of crystal lattice planes (mosaic spread) within the sample. This orientation distribution can be directly used as a measure of perfection . The SmartLab diffractometer with high-resolution beam conditioner gives the necessary resolution to determine the perfection of high-quality crystalline films and substrates.
Relationship between mosaic spread and rocking curve profile
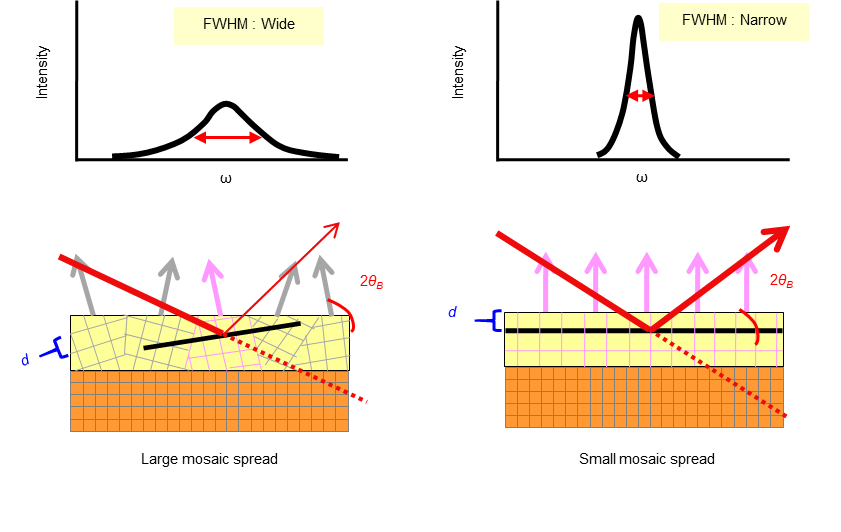
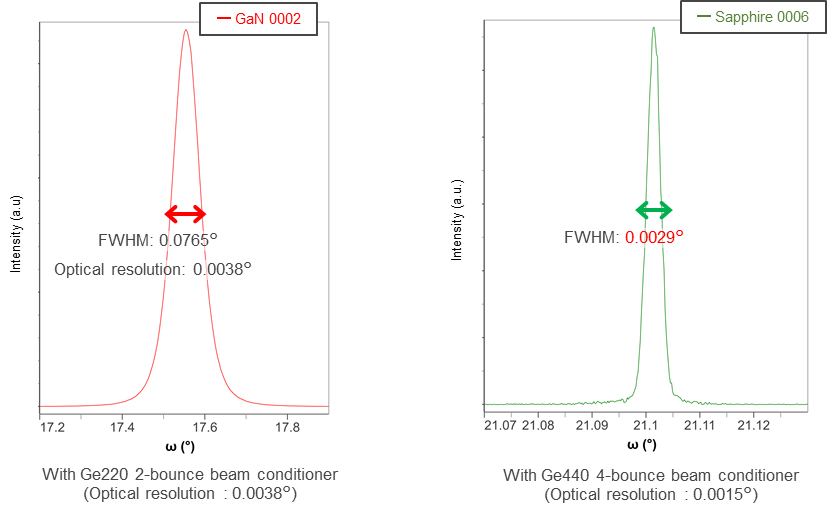
The profiles below show the result of X-ray rocking curve measurements performed on a sapphire substrate with a 2μm thick GaN buffer layer grown on it. By using the appropriate beam conditioner for the epitaxial layer and mono-crystal substrate, the profiles of each layer and substrate could be clearly observed. The width (FWHM) of each peak demonstrates the relative crystal quality of the substrate and film layer.
The Rocking curve profiles of the sapphire substrate and a 2μm thick GaN buffer layer on it
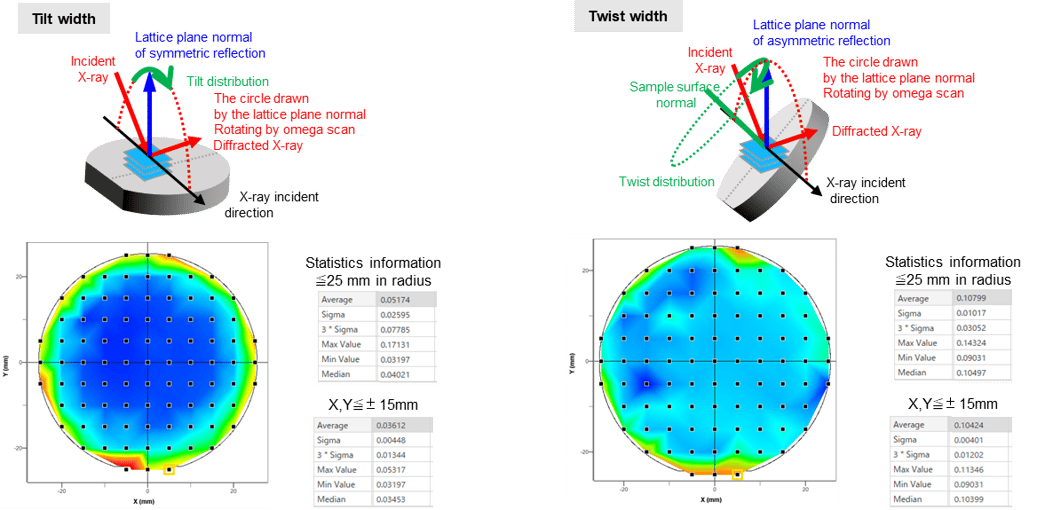
2. Evaluation of crystal quality uniformity across a wafer
For AlGaN-based deep-UV LEDs, to improve the internal quantum efficiency and extend device life time, enhanced quality of the AlN buffer layer is critical. The appropriate quality metric for AlN buffer layers is dislocation density. The densities of two types of dislocations, edge dislocation, and screw dislocation, can be estimated from the widths of different X-ray rocking curve measurements. The first type of measurement makes use of a skew geometry to measure (hk0) reflections, and second measurement uses a symmetric geometry to measure (001) reflections. For commercialization and mass production of deep-UV LEDs, the rocking curve widths should ideally be uniform over a large area of the wafer. The data visualization plugin in SmartLabStudio II software quickly processes the large number of the rocking curve measurements collected by the XY-mapping measurement and allows visualization and statistical analysis of the rocking curve widths.
Tilt and twist distribution mapping of the AlN layer on the 2-inch sapphire substrate
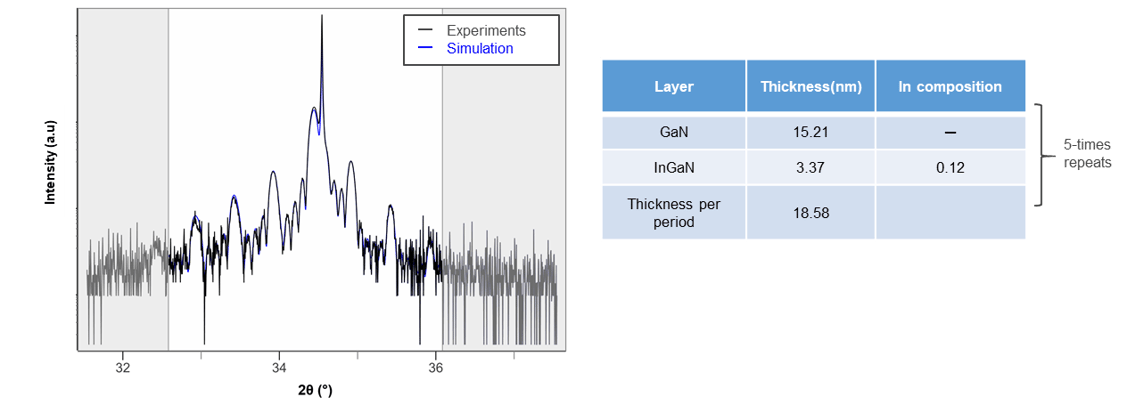
3. Thickness and composition measurement by high-resolution rocking curve (2θ/ω scan)
Thickness and composition of the compound layer are critical performance parameters for electronics devices. High-resolution rocking curve (2θ/ω scan) measurements allow the determined of both critical parameters. The figure below shows a measured profile of a high resolution rocking along with the optimized simulation used to model the sample (GaN/InxGa(1-x)N multi-quantum well (MQW) on GaN buffer layer). The thickness of GaN and InGaN layers in the MQW, and the Indium composition of the InGaN layer were determined by this profile fitting.
High resolution (2θ/ω) rocking curve used to determine layer thicknesses and composition for a GaN / InxGa(1-x)N MQW
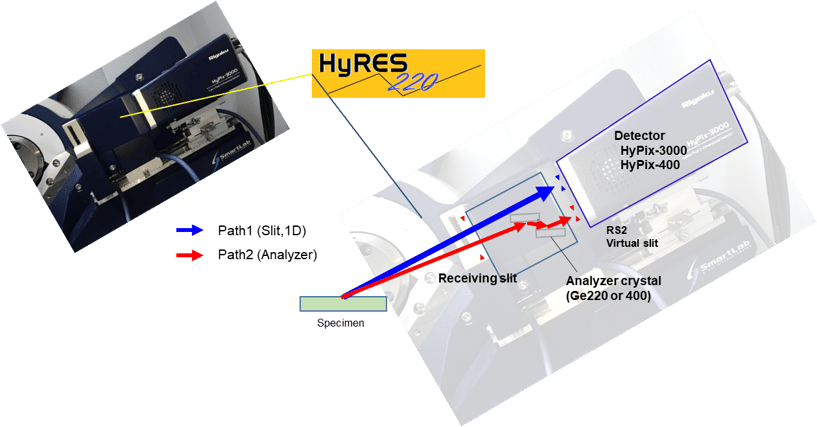
4. Fast and high-resolution measurement of reciprocal space maps (RSM) using a HyRES unit
HyRES 220 and 400 are unique X-ray optical systems for the evaluation of epitaxial films and mono-crystal substrates. Each receiving optical component enables two potential beam paths and hence two very different instrument performance modes. As illustrated below, the two optical beam paths are straight through and analyzer crystal, that can be automatically switch by the software.
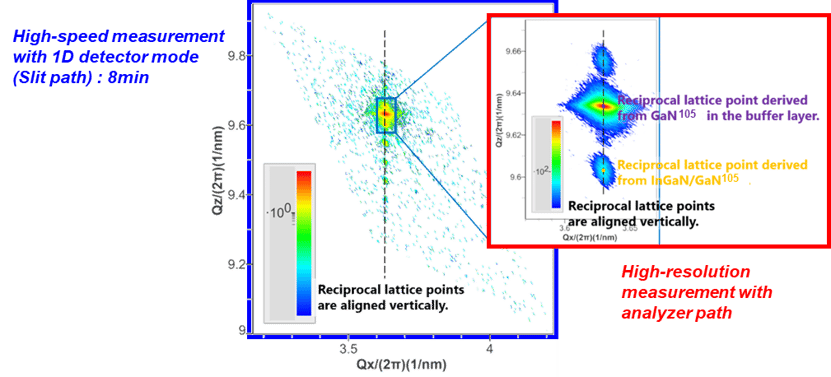
Reciprocal Space Mapping is often used in the determination of lattice mismatch and lattice parameter of epitaxial films. Both high speed and high-resolution RSM data can be collected using the HyRES unit. Using a combination of these two measurement types, the data presented below was collected on a GaN buffer layer. The lattice parameter of the GaN buffer layer was calculated as : a=3.182Å, c=5.190Å, and the MQW grown on top on it was determined to be fully strained.
High speed RSM and high-resolution RSM around GaN105 with HyRES 220 optical unit
SmartLab